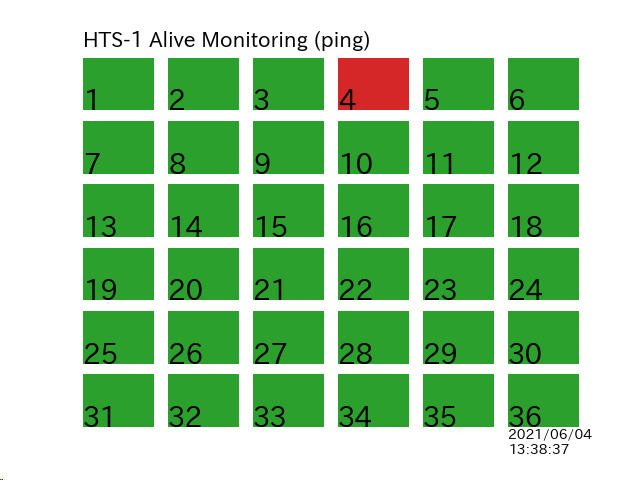
pingを飛ばすのに pings というパッケージを使った pip install pings でインストール可能。次の例では36台のPCを監視している。
import datetime
import matplotlib.pyplot as plt
import pings

hosts = []
for i in range(1, 37):
    hosts.append("192.168.0.{}".format(i))

p = pings.Ping(timeout=1000)
xs = [0, 1, 1, 0, 0]
ys = [0, 0, 1, 1, 0]
for i, h in enumerate(hosts):
    plt.subplot(6, 6, i+1)
    if i == 0:
        plt.text(0, 1.2, "HTS-1 Alive Monitoring (ping)", size=15)
    if i == len(hosts)-1:
        plt.text(
            0, -0.5, datetime.datetime.now().strftime('%Y/%m/%d\n%H:%M:%S'), size=10)
    plt.text(0, 0, str(i+1), size=20)
    plt.axis("off")
    res = p.ping(h)
    if not res.is_reached():
        plt.fill(xs, ys, color="tab:red")
        plt.axis([0.0, 1.0, 0.0, 1.0])
        print("Not connected", h)
    else:
        plt.fill(xs, ys, color="tab:green")
        plt.axis([0.0, 1.0, 0.0, 1.0])
        print("Connected", h)
plt.savefig("AliveHTS1.png")
生成した画像は、ブラウザ上で見たい。例えば上記のプログラムを1分ごとに自動実行するようにしておけば、それ以上の頻度で画像を読み込めば最新の状況が見れる。
画像の再読み込み(自動リロード)は、一般的な方法である末尾に?と乱数を付けることで実装した。コード例は10秒ごと。実装は下記のURLを参考にした。
<!DOCTYPE HTML PUBLIC "-//W3C//DTD HTML 3.2 Draft//EN">
<html>
<head>
    <title>HTS-1 Alive Monitoring</title>
    <script>
        function reloadimg() {
            AliveHTS1.src = "./AliveHTS1.png?r=" + Math.random();
        }
        function setreload(timer) {
            setTimeout('reloadimg()', timer);
        }
    </script>
</head>
<body>
    <img name="AliveHTS1" src="./AliveHTS1.png" onload="setreload(10000)" />
</body>
</html>
こんな感じで表示される