長方形を描画 matplotlib.patches.Rectangle
サンプルコード
 import matplotlib.pyplot as plt
x,y,width,height = 5,10,20,10
rect = plt.Rectangle((x,y), width, height, edgecolor="black", facecolor="tab:orange")
plt.gca().add_patch(rect)
plt.xlim(0,50)
plt.ylim(0,50)
plt.gca().set_aspect(1)
plt.show()

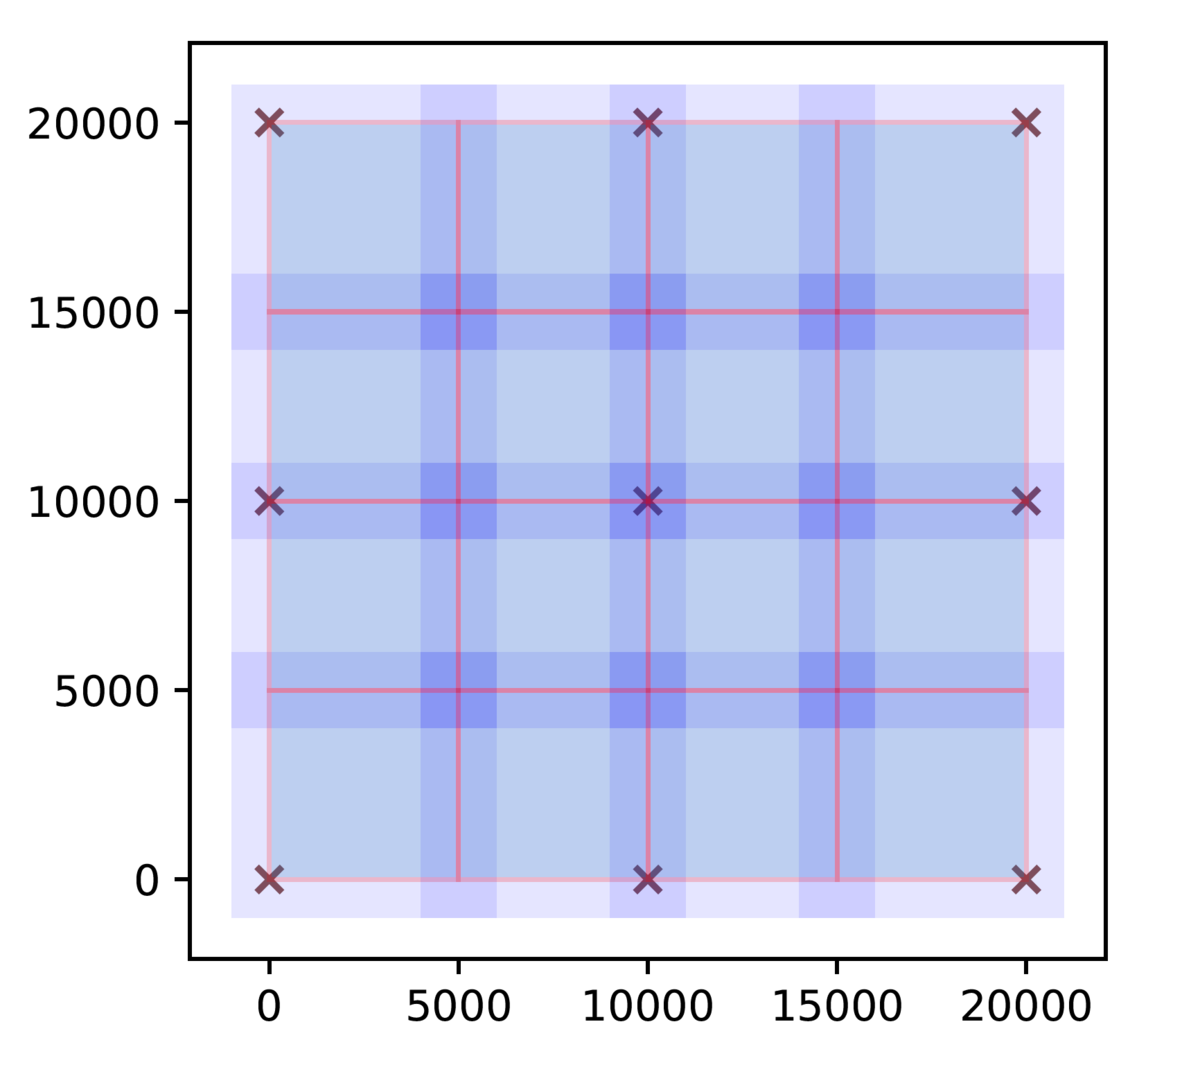
 0 0 0 -1000.0  6000.0 -1000.0  6000.0     0.0  5000.0     0.0  5000.0 -
 1 1 0  4000.0 11000.0 -1000.0  6000.0  5000.0 10000.0     0.0  5000.0 -
 2 2 0  9000.0 16000.0 -1000.0  6000.0 10000.0 15000.0     0.0  5000.0 -
 3 3 0 14000.0 21000.0 -1000.0  6000.0 15000.0 20001.0     0.0  5000.0 -
 4 0 1 -1000.0  6000.0  4000.0 11000.0     0.0  5000.0  5000.0 10000.0 -
 5 1 1  4000.0 11000.0  4000.0 11000.0  5000.0 10000.0  5000.0 10000.0 -
 6 2 1  9000.0 16000.0  4000.0 11000.0 10000.0 15000.0  5000.0 10000.0 -
 7 3 1 14000.0 21000.0  4000.0 11000.0 15000.0 20001.0  5000.0 10000.0 -
 8 0 2 -1000.0  6000.0  9000.0 16000.0     0.0  5000.0 10000.0 15000.0 -
 9 1 2  4000.0 11000.0  9000.0 16000.0  5000.0 10000.0 10000.0 15000.0 -
10 2 2  9000.0 16000.0  9000.0 16000.0 10000.0 15000.0 10000.0 15000.0 -
11 3 2 14000.0 21000.0  9000.0 16000.0 15000.0 20001.0 10000.0 15000.0 -
12 0 3 -1000.0  6000.0 14000.0 21000.0     0.0  5000.0 15000.0 20001.0 -
13 1 3  4000.0 11000.0 14000.0 21000.0  5000.0 10000.0 15000.0 20001.0 -
14 2 3  9000.0 16000.0 14000.0 21000.0 10000.0 15000.0 15000.0 20001.0 -
15 3 3 14000.0 21000.0 14000.0 21000.0 15000.0 20001.0 15000.0 20001.0 -
というdc2.lstというファイル名のテキストがあったとする。
matplotlibで長方形を描画するためのRectangleを使う。edgecolor or ec、facecolor or fc を使って輪郭と面の色を指定する。
import matplotlib.pyplot as plt
import matplotlib.patches as patches
fig = plt.figure()
ax = fig.add_subplot(111)

xs=[]
ys=[]

for x in range(3):
    for y in range(3):
        xs.append(x*10000)
        ys.append(y*10000)
ax.scatter(xs,ys,marker="x",color="tab:brown")
with open("dc2.lst") as f:
    lines = f.readlines()
    for line in lines:
        strs = line.split()
        x=float(strs[3])
        y=float(strs[5])
        w=float(strs[4])-float(strs[3])
        h=float(strs[6])-float(strs[5])
        rect = plt.Rectangle((x,y),w,h,fc="#0000ff",alpha = 0.1)
        ax.add_patch(rect)
        xi=float(strs[7])
        yi=float(strs[9])
        wi=float(strs[8])-float(strs[7])
        hi=float(strs[10])-float(strs[9])
        rect = plt.Rectangle((xi,yi),wi,hi,ec="#ff0000",alpha = 0.2)
        ax.add_patch(rect)
ax.set_aspect('equal')
plt.show()