物理の駅 Physics station by 現役研究者

テクノロジーは共有されてこそ栄える

ROOT: TFile形式で1億イベントのtreeのIO(入出力)速度を圧縮形式で比較する

CERN ROOT の TTreeを TFileで入出力するときの処理時間を圧縮形式ごとに比較してみる。Pythonで同様のことをやった記事も参照。

8バイト(int64_t)✕8メンバー✕1億エントリーなので、圧縮なしの場合は6.4GBのデータサイズとなる。

圧縮形式 ファイルサイズ 出力時間 読み込み時間
無圧縮=0 6.40 GB 36 sec 14 sec
kZLIB=1 1.23 GB 63 sec 22 sec
kLZMA=2 0.24 GB 220 sec 59 sec
=3 1.23 GB 62 sec 23 sec
kLZ4=4 3.22 GB 37 sec 16 sec
kZSTD=5 0.56 GB 39 sec 25 sec

結果を見る限り、デフォルト kZLIB は圧縮率、時間のバランスはよくない。データの質にもよるが、kZSTD を選んでおけばほとんどのデータに対応できるだろう。ただし、ROOT6のZSTDで圧縮したファイルをROOT5で読むことは(たぶん)できない。

ROOTファイル出力のコード。データは圧縮しやすい内容にした。WindowsでVisual Studioでコンパイルして実行した。

void writeTreeToFile(std::string filename, int compressionAlgorithm = 1) {
    TFile* file = new TFile(filename.c_str(), "RECREATE");
    if (compressionAlgorithm == 0) {
        file->SetCompressionLevel(0);
    }
    else {
        file->SetCompressionAlgorithm(compressionAlgorithm);
    }
    TTree* tree = new TTree("tree", "Tree Title");

    int64_t x, y, ax, ay, ax0, ay0, ax1, ay1;

    // 1億本
    int N = 1 * 10000 * 10000;
    tree->Branch("x", &x, "x/L", N);
    tree->Branch("y", &y, "y/L", N);
    tree->Branch("ax", &ax, "ax/L", N);
    tree->Branch("ay", &ay, "ay/L", N);
    tree->Branch("ax0", &ax0, "ax0/L", N);
    tree->Branch("ay0", &ay0, "ay0/L", N);
    tree->Branch("ax1", &ax1, "ax1/L", N);
    tree->Branch("ay1", &ay1, "ay1/L", N);

    for (int i = 0; i < N; i++) {
        x = i;
        y = i;
        ax = i;
        ay = i;
        ax0 = i;
        ay0 = i;
        ax1 = i;
        ay1 = i;
        tree->Fill();
    }

    tree->Write();

    file->Close();
    delete file;
}

ROOTファイル読み込みコード

#include <TFile.h>
#include <TTree.h>
#include <iostream>
void readTreeFromFile(std::string filename) {

    TFile* f = new TFile(filename.c_str());
    TTree* tree = (TTree*)f->Get("tree");
    std::cout << tree->GetMaximum("x") << " ";
    std::cout << tree->GetMaximum("y") << " ";
    std::cout << tree->GetMaximum("ax") << " ";
    std::cout << tree->GetMaximum("ay") << " ";
    std::cout << tree->GetMaximum("ax0") << " ";
    std::cout << tree->GetMaximum("ay0") << " ";
    std::cout << tree->GetMaximum("ax1") << " ";
    std::cout << tree->GetMaximum("ay1") << " ";
    f->Close();
}

圧縮アルゴリズムのROOT上の定義

ROOT::RCompressionSetting::EAlgorithm::kZLIB; //ZLIB デフォルト
ROOT::RCompressionSetting::EAlgorithm::kLZMA; //LZMA Lempel-Ziv-Markov chain-Algorithm
ROOT::RCompressionSetting::EAlgorithm::kOldCompressionAlgo; // 古いの
ROOT::RCompressionSetting::EAlgorithm::kLZ4; //LZ4
ROOT::RCompressionSetting::EAlgorithm::kZSTD; //ZSTD 

1億イベントのtreeデータのグラフ化の速度をPythonとROOTで比較する

この記事の Awkward のバージョンは1.X.Xです

データはここのを使う。64バイト(double 8個)×1億イベント(エントリー)である。

phst.hateblo.jp

結果のまとめ

言語 ライブラリ ファイル形式 処理時間 スレッド数
Python awkward parquet 46 sec 1
C++ ROOT TTree ROOT 100 sec 1
C++ ROOT RDataFrame ROOT 22 sec (不安定) 8
Python uproot+awkward ROOT 76 sec 1

まずはPythonコード。Pythonでは標準であろうparquet形式を読み込み、テンポラリーなメンバー da を作成する。さらに、カット条件を適用したテンポラリー tree_cutも作成する。matplotlibで描画する。手元のPCでは約46秒かかった。

import time
import awkward as ak
import matplotlib.pyplot as plt
from matplotlib.ticker import ScalarFormatter

start = time.time()

tree = ak.from_parquet("tree.parquet", lazy=True)

tree["da"] = ((tree["ax0"]-tree["ax1"])**2+(tree["ay0"]-tree["ay1"])**2)**0.5
tree_cut = tree[tree["da"]<0.4]

fig, axes = plt.subplots(ncols=2,nrows=2)
ax=axes.flat[0]
ax.hist2d(tree["x"],tree["y"],bins=[300,300],range=[[0,300],[0,300]])

ax=axes.flat[1]
ax.hist2d(tree["ax"],tree["ay"],bins=[150,150],range=[[-1.5,1.5],[-1.5,1.5]])

ax=axes.flat[2]
ax.hist(tree["da"], bins=1000,range=[0,2])
ax.yaxis.set_major_formatter(ScalarFormatter(useMathText=True))
ax.ticklabel_format(axis="y", style='scientific', scilimits=[3,3])
ax.set_xlim(0,2.0)

ax=axes.flat[3]
ax.hist(tree_cut["da"], bins=1000,range=[0,2])
ax.yaxis.set_major_formatter(ScalarFormatter(useMathText=True))
ax.ticklabel_format(axis="y", style='scientific', scilimits=[3,3])
ax.set_xlim(0,2.0)

plt.savefig("plot_python.pdf")

plt.clf()
plt.cla()
plt.close()

end = time.time()
print(f"{(end-start)*1000:.0f} [msec]")

次に、ROOTで書く。普通の TFile TTreeを使った書き方である。手元のPCでは約100秒 (Pythonの約2倍)かかった。

#include <TFile.h>
#include <TTree.h>
#include <TH2D.h>
#include <TH1D.h>
#include <TCanvas.h>

#include <iostream>

void makeGraph1() {

    TFile* f = new TFile("output.root");
    TTree* tree = (TTree*)f->Get("tree");

    TH2D* h1 = new TH2D("h1", "pos. dist.", 300, 0, 300, 300, 0, 300);
    TH2D* h2 = new TH2D("h2", "ang. dist.", 150, -1.5, 1.5, 150, -1.5, 1.5);

    TH1D* h3 = new TH1D("h3", "before cut", 1000, 0, 2);
    TH1D* h4 = new TH1D("h4", "after cut", 1000, 0, 2);

    TCanvas* c1 = new TCanvas();
    c1->Divide(2, 2);
    c1->cd(1); tree->Draw("y:x>>h1", "", "colz");
    c1->cd(2); tree->Draw("ay:ax>>h2", "", "colz");
    c1->cd(3); tree->Draw("sqrt((ax0-ax1)*(ax0-ax1)+(ay0-ay1)*(ay0-ay1))>>h3");
    c1->cd(4); tree->Draw("sqrt((ax0-ax1)*(ax0-ax1)+(ay0-ay1)*(ay0-ay1))>>h4", "(ax0-ax1)*(ax0-ax1)+(ay0-ay1)*(ay0-ay1)<0.4*0.4");
    c1->Print("plot_root1.pdf");
}

RDataFrameを使うと高速化できるらしい。ただし、手元の環境では、コンパイルには成功するものの、実行すると、正常終了したり、コード -1073740940 で終了しました。 というエラーメッセージが出て終了してしまったりと、挙動が安定しない。成功すると、全スレッド使って約22秒で終了する。数スレッド並列にするだけで30秒台になったので、有効なのは間違いないが、Pythonは並列なしで46秒なのでコアあたりの速度はPythonの方がこの程度ではまだ優位である。

環境

  • root_v6.30.04.win64.vc17
  • VS 2022 17.9.1
  • Windows 11 Pro 23H2
#include <ROOT/RDataFrame.hxx>
#include <TCanvas.h>

void makeGraph2() {

    ROOT::EnableImplicitMT();
    ROOT::RDataFrame df("tree", "output.root");

    auto dang_cut = [](double ax0, double ay0, double ax1, double ay1) {return (ax0 - ax1) * (ax0 - ax1) + (ay0 - ay1) * (ay0 - ay1) < 0.4 * 0.4; };
    auto df_cut = df.Filter(dang_cut, { "ax0","ay0","ax1","ay1" });

    auto h1 = df.Histo2D({ "h1","pos. dist.",300,0,300,300,0,300 }, "x", "y");
    auto h2 = df.Histo2D({ "h2","ang. dist.",150,-1.5,1.5,150,-1.5,1.5 }, "ax", "ay");
    auto h3 = df.Define("da", "sqrt((ax0-ax1)*(ax0-ax1)+(ay0-ay1)*(ay0-ay1))").Histo1D({ "h3", "before cut", 1000, 0, 2 }, "da");
    auto h4 = df_cut.Define("da", "sqrt((ax0-ax1)*(ax0-ax1)+(ay0-ay1)*(ay0-ay1))").Histo1D({ "h4", "after cut", 1000, 0, 2 }, "da");

    TCanvas* c1 = new TCanvas();
    c1->Divide(2, 2);
    c1->cd(1); h1->Draw("colz");
    c1->cd(2); h2->Draw("colz");
    c1->cd(3); h3->Draw();
    c1->cd(4); h4->Draw();
    c1->Print("plot_root_MT.pdf");
}

コード -1073740940 はDWORDで C0000374。ヒープ破損の例外が飛んだことを意味する。

最後に、Pythonでrootファイルを読む。uprootというライブラリを使うと良い。読んだ後の形式は awkward=ak とする。awkward から直接 parquetファイルを読んだ場合よりも 30秒余分にかかったので、(少なくともデフォルトの)ROOTファイルのパフォーマンスはparquetより低いことが分かる。

import uproot
tree = uproot.concatenate("output.root:tree",library ="ak")

Windows ROOTとPython(numpy,awkward)でTreeファイルの生成と出力時間を比べる

この記事の Awkward のバージョンは1.X.Xです

エマルションの飛跡情報(x,y,ax,ay,ax0,ay0,ax1,ay1)とする。Visual StudioでコンパイルしたROOTと、Python+numpy,awkwardで作ったバージョンを比較する。イベント数は1億(108)本とする。

Visual Studio でコンパイルしたROOT版。248秒もかかった。

#include <TFile.h>
#include <TTree.h>
#include <iostream>

#include <random>
#include <chrono>

void writeTreeToFile() {
    TFile* file = new TFile("output.root", "RECREATE");
    TTree* tree = new TTree("tree", "Tree Title");

    double x, y, ax, ay, ax0, ay0, ax1, ay1;

    tree->Branch("x", &x, "x/D");
    tree->Branch("y", &y, "y/D");
    tree->Branch("ax", &ax, "ax/D");
    tree->Branch("ay", &ay, "ay/D");
    tree->Branch("ax0", &ax0, "ax0/D");
    tree->Branch("ay0", &ay0, "ay0/D");
    tree->Branch("ax1", &ax1, "ax1/D");
    tree->Branch("ay1", &ay1, "ay1/D");

    int seed = 0;
    std::mt19937 gen(seed);
    std::uniform_real_distribution<double> dist_pos(0, 300);  // 一様分布 位置 mm
    std::uniform_real_distribution<double> dist_sn(0, 1);     // 一様分布 SN

    std::normal_distribution<double> dist_ang(0, 0.4);            // 正規分布 角度分布
    std::normal_distribution<double> dist_dang_signal(0, 0.1);    // 正規分布 角度差分布

    // 1億本
    for (int i = 0; i < 1 * 10000 * 10000; i++) {
        x = dist_pos(gen);
        y = dist_pos(gen);
        ax = dist_ang(gen);
        ay = dist_ang(gen);
        if (dist_sn(gen) < 0.2) {
            //シグナル成分
            ax0 = ax + dist_dang_signal(gen);
            ay0 = ay + dist_dang_signal(gen);
            ax1 = ax + dist_dang_signal(gen);
            ay1 = ay + dist_dang_signal(gen);
        }
        else {
            //ノイズ成分
            ax0 = ax + dist_dang_signal(gen) * 5;
            ay0 = ay + dist_dang_signal(gen) * 5;
            ax1 = ax + dist_dang_signal(gen) * 5;
            ay1 = ay + dist_dang_signal(gen) * 5;
        }

        tree->Fill();
    }

    tree->Write();

    file->Close();
    delete file;
}

int main() {
    auto start = std::chrono::system_clock::now();   //開始時間
    writeTreeToFile();
    auto end = std::chrono::system_clock::now(); //終了時間

    std::cout << std::chrono::duration_cast<std::chrono::milliseconds>(end - start).count() << " [msec]" << std::endl;
    return 0;
}

次にPython+numpy,awkward版。31秒 (C++の8分の1)で終わった。

import awkward as ak
import numpy as np
import time

start = time.time()

seed=0
rs = np.random.RandomState(seed)

N = 1 * 10000 * 10000
tree = ak.Array({})
tree["x"] = rs.uniform(0,300,N)
tree["y"] = rs.uniform(0,300,N)
tree["ax"] = rs.normal(0,0.4,N)
tree["ay"] = rs.normal(0,0.4,N)
tree["SN"] = rs.uniform(0,1,N)<0.2

diff_sigma = ak.where(tree["SN"], 0.1, 0.5)

tree["ax0"] = tree["ax"] + rs.normal(0,1,N)*diff_sigma
tree["ay0"] = tree["ay"] + rs.normal(0,1,N)*diff_sigma
tree["ax1"] = tree["ax"] + rs.normal(0,1,N)*diff_sigma
tree["ay1"] = tree["ay"] + rs.normal(0,1,N)*diff_sigma

ak.to_parquet(tree, "tree.parquet")

end = time.time()
print(f"{(end-start)*1000:.0f} [msec]")

グラフも作っておく

位置分布

import matplotlib.pyplot as plt
plt.hist2d(tree["x"],tree["y"],bins=[300,300],range=[[0,300],[0,300]])
plt.show()

角度分布

plt.hist2d(tree["ax"],tree["ay"],bins=[300,300],range=[[-1.5,1.5],[-1.5,1.5]])
plt.show()

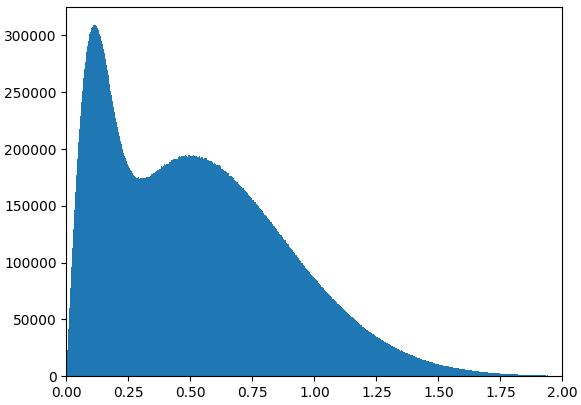
角度差分布

plt.hist(((tree["ax1"]-tree["ax"])**2+(tree["ay1"]-tree["ay"])**2)**0.5,bins=1000,range=[0,2])
plt.xlim(0,2)
plt.show()

Windows + Visual StudioでCERN ROOT6 64bit版 を動かす (2024年)

最終更新: 2024/02/24

CERNのROOT Release 6.26/04 - 2022-06-07 から Windows用のプリコンパイル済みバイナリが配布されはじめた。当初はバグがありまともに動かなかったと思われるが、執筆時点での最新 Release 6.30.04 - 2024-01-31 は1.5年も経過しそれなりにバグ出しが進んだと期待される。

ROOT6を取り巻く状況

2021年ごろまでは、WindowsではROOTの32bit版しか動かなかったが、64bit対応が進められ、2024年2月時点では、それなりに動く64bit版バイナリが配布されています。

ROOT6のビルド済みバイナリをライブラリとして使う

Windows + Visual Studio (VS)を使って、ROOT6 64bit版をライブラリとして使ってみる。まずは、CERNのサイトからZIPファイルをダウンロードして、任意の場所に展開しておく。以下、Cドライブの直下に展開したとして話をすすめる。つまり、binフォルダは"C:\root_v6.30.04.win64.vc17\root\bin" にある。

基本的な使い方は 最終更新: 2021/10/24 の32bit版の記事と同じである。

  • Visual Studio 2019 Community または Visual Studio 2022 Communityを用意。インストール時にC++によるデスクトップ開発にチェックを入れる。Community版のかわりに、Professional版やEnterprise版でもよい。
  • C++の空のプロジェクトを作成 ここではプロジェクト名をProject1とする。
  • 構成マネージャ (上の方) を Release x64に変更
  • プロジェクトのプロパティページのVC++ディレクトリのインクルードディレクトリにC:\root_v6.30.04.win64.vc17\root\includeを追加
  • リンカーの入力の追加の依存ファイルにC:\root_v6.30.04.win64.vc17\root\lib\*.libを追加
  • PATHにC:\root_v6.30.04.win64.vc17\root\binを追加。VS内で追加するときはデバッグの環境にPATH=C:\root_v6.30.04.win64.vc17\root\bin;%PATH%を追加
  • 構成プロパティの全般のC++言語標準を、ISO C++17標準 (/std:c++17)に変更
  • ソースファイルからC++ファイルを追加
  • C/C++のプリプロセッサのプリプロセッサの定義に、_CRT_SECURE_NO_WARNINGSを追加
  • サンプルコードを C++ と ROOT6版 ガウス分布をフィッティング ($2194393) · Snippets · GitLab からコピペ

Javascript Vue.js を使って非同期でデータを表示する

Vue.js を使って非同期でデータを表示する。

Vue.jsのチュートリアルの10番目を参考にした。

v-if で 表示の条件分岐ができるようだ。

<!DOCTYPE html>
<html lang="ja">
<head>
    <meta charset="UTF-8">
    <title>Vue.js test step-10</title>
    <script type="importmap">
        { "imports": {
            "vue":        "https://unpkg.com/vue@3/dist/vue.esm-browser.js"
        } }
      </script>
</head>
<body>
    <script type="module">
/*ここは下のJavascriptをコピペする*/
    </script>

    <div id="app">
        <p>Todo id: {{ todoId }}</p>
        <button @click="todoId++" :disabled="!todoData">Fetch next todo</button>
        <p v-if="!todoData">Loading...</p>
        <pre v-else>{{ todoData }}</pre>
    </div>
</body>
</html>

<script type="module"></script> の間は以下のように書く。

    <script type="module">
        import { createApp, ref, watch } from 'vue'

        createApp({
            setup() {
                const todoId = ref(1)
                const todoData = ref(null)

                async function fetchData() {
                    todoData.value = null
                    const res = await fetch(
                        `https://jsonplaceholder.typicode.com/todos/${todoId.value}`
                    )
                    todoData.value = await res.json()
                }

                fetchData()
                watch(todoId, fetchData)
                return { todoId, todoData }
            }
        }).mount('#app')
    </script>