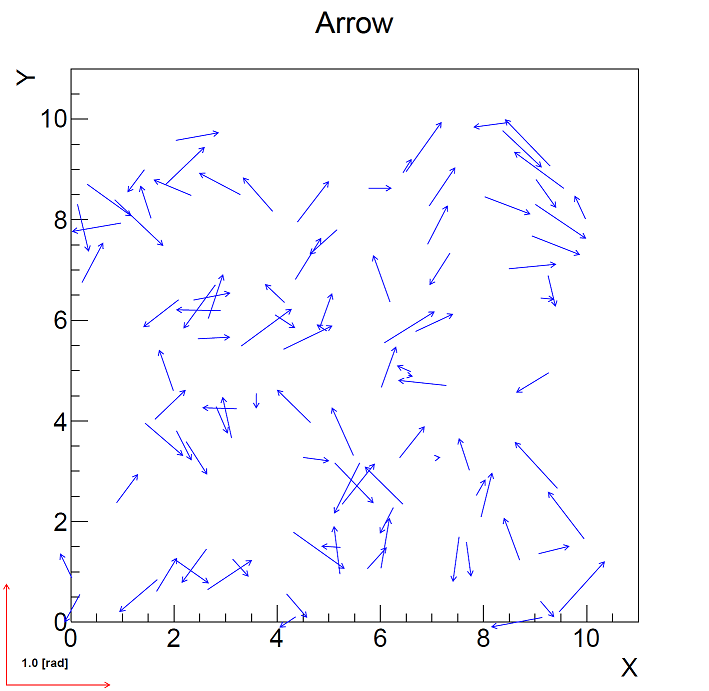
CERNが開発しているROOT (バージョン5)を用いた検出器内の飛跡を2次元プロジェクションに投影して描画する方法。 具体的には三次元情報を持つ飛跡を2次元に投影したい時に使う。
#include <vector>
#include <random>
#include <limits>
#include <TArrow.h>
#include <TGraph.h>
#include <TAxis.h>
#include <TCanvas.h>
#include <TPaveText.h>
class Track
{
public:
    double px, py, ax, ay;
};
int main()
{
    std::random_device rand;
    std::vector<Track> vtrack;

    double width = 10;
    double height = 10;

    TCanvas *c1 = new TCanvas("c1", "", 1000, 1000);

    for (int i = 0; i < 100; i++) {
        Track t;
        t.px = double(rand()) / std::numeric_limits<unsigned int>::max() * width;
        t.py = double(rand()) / std::numeric_limits<unsigned int>::max() * height;
        t.ax = double(rand()) / std::numeric_limits<unsigned int>::max() - 0.5;
        t.ay = double(rand()) / std::numeric_limits<unsigned int>::max() - 0.5;
        vtrack.emplace_back(t);
    }
    double extz = 2; //ファクター
    double arrowsize = 0.01;

    TGraph* dummy = new TGraph();
    dummy->SetPoint(0, 0, 0); //左下
    dummy->SetPoint(1, width , height ); //右下
    dummy->SetMarkerColor(0); //マーカー色は白に

    dummy->GetXaxis()->SetTitle("X");
    dummy->GetXaxis()->SetLabelSize(0.04);
    dummy->GetXaxis()->SetTitleSize(0.04);

    dummy->GetYaxis()->SetTitle("Y");
    dummy->GetYaxis()->SetLabelSize(0.04);
    dummy->GetYaxis()->SetTitleSize(0.04);

    dummy->SetTitle("Arrow");
    dummy->Draw("AP"); //軸とポイントを描画

    for (auto p : vtrack) {

        TArrow *arrow = new TArrow(p.px, p.py, p.px + (p.ax)*extz, p.py + (p.ay)*extz, arrowsize, ">");
        arrow->SetFillColor(kBlue);
        arrow->SetLineColor(kBlue);
        arrow->SetFillStyle(1001);
        arrow->SetLineWidth(1);
        arrow->SetLineStyle(1);
        arrow->Draw();
    }

    //リファレンスの矢印
    double ref_px = -width / 8, ref_py = -height / 8;
    {
        TArrow *arrow = new TArrow(ref_px, ref_py, ref_px + extz, ref_py, arrowsize, ">");
        arrow->SetFillColor(kRed);
        arrow->SetLineColor(kRed);
        arrow->SetFillStyle(1001);
        arrow->SetLineWidth(1);
        arrow->SetLineStyle(1);
        arrow->Draw();
    }
    {
        TArrow *arrow = new TArrow(ref_px, ref_py, ref_px, ref_py + extz, arrowsize, ">");
        arrow->SetFillColor(kRed);
        arrow->SetLineColor(kRed);
        arrow->SetFillStyle(1001);
        arrow->SetLineWidth(1);
        arrow->SetLineStyle(1);
        arrow->Draw();
    }
    //リファレンスの文字
    double text_px = -width / 10, text_py = -height / 10;
    {
        TPaveText *pt = new TPaveText(text_px, text_py, 0, text_py + height / 30, "br");
        pt->SetFillColor(0);
        pt->SetLineColor(0);
        pt->SetShadowColor(0);
        TText *text = pt->AddText("1.0 [rad]");
        pt->Draw();
    }

    c1->SaveAs("Arrow.pdf");

    return 0;
}
作った画像
