最新の投稿
過去の投稿
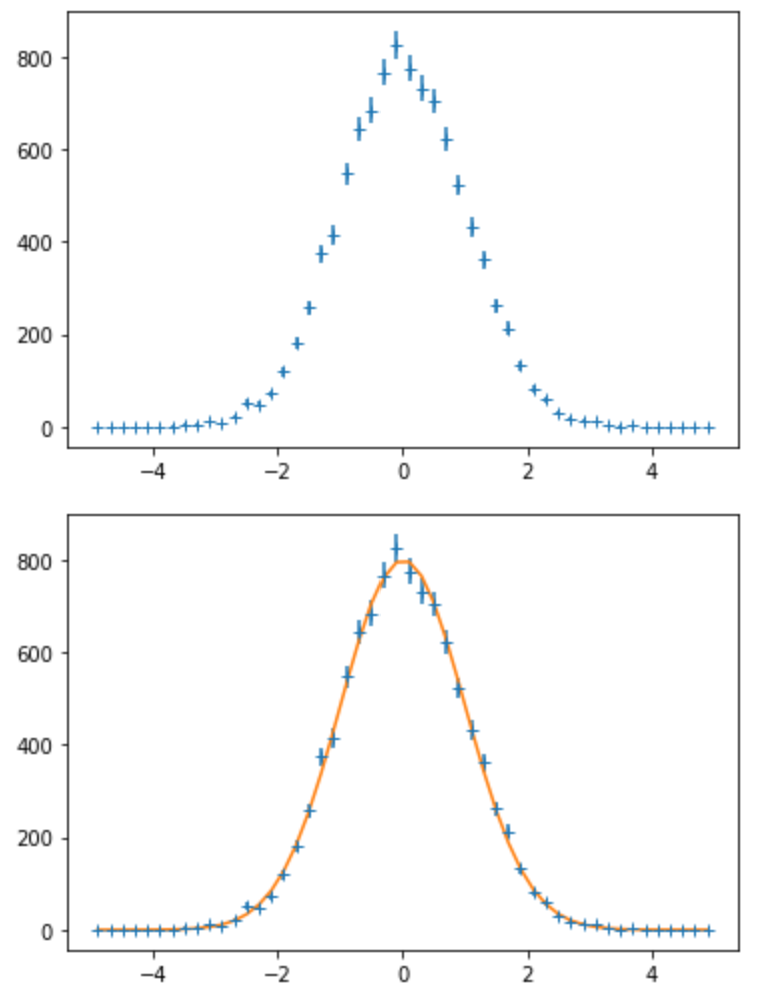
これを少し汎用化して、リスト、ビンの数、最小値、最大値を与えて、正規分布でフィッティングする関数を作ってみた。
オプションで平均値の初期値、標準偏差の初期値、グラフを描画するかどうかを与える。
注: グラフの縦方向のエラーが分かりにくかったので、 plot -> errorbar へ修正した
使い方
import numpy.random
fit_gaussian(numpy.random.randn(10000),50,-5,5,show_plot=True)
関数
import math

def fit_gaussian(vx, nbin,min_x,max_x,*,mean_value=None,stdev_value=None,show_plot=False):
    '''
    return chi2, constant, error, mean, error, sigma, error, degree of freedom
    '''
    if len(vx) == 0:return 0,0,0,0,0,0,0,0
    import numpy as np
    import pandas as pd
    import matplotlib.pyplot as plt
    from scipy.optimize import curve_fit
    from scipy.stats import norm
    from scipy.stats import chisquare
    from statistics import mean, median,variance,stdev

    def gaussian_func(x, constant, mean, sigma):
        return constant * np.exp(- (x - mean) ** 2 / (2 * sigma ** 2))

    arr_x = [0 for i in range(nbin)]
    arr_y = [0 for i in range(nbin)]
    arr_yerror = [0 for i in range(nbin)]

    wbin = (max_x - min_x) / nbin
    if wbin <= 0:return 0,0,0,0,0,0,0,0

    for i in range(nbin): arr_x[i] = min_x + wbin * (i + 0.5)

    for x in vx:
        bin = math.floor((x - min_x) / wbin)
        if bin < 0:continue
        if bin >= nbin:continue
        arr_y[bin]+=1

    for i in range(nbin): arr_yerror[i] = math.sqrt(arr_y[i])

    if show_plot:
        import matplotlib.pyplot as plt
        plt.errorbar(arr_x,arr_y,linestyle="None",marker="+",yerr=arr_yerror)
        plt.show()

    if mean_value != None and stdev_value != None:
        parameter_initial = np.array([max(arr_y), mean_value, stdev_value]) #初期値は適宜与えるべし
    else:
        parameter_initial = np.array([max(arr_y), mean(vx), stdev(vx)]) #初期値は適宜与えるべし

    arr_x2 = []
    arr_y2 = []
    arr_yerror2 = []
    for x,y,yerror in zip(arr_x,arr_y,arr_yerror): #entry=0のデータを除外
        if y == 0:continue
        arr_x2.append(x)
        arr_y2.append(y)
        arr_yerror2.append(yerror)

    if len(arr_x2) < 4:return 0,0,0,0,0,0,0,0

    popt, pcov = curve_fit(gaussian_func, arr_x2, arr_y2, sigma=arr_yerror2,absolute_sigma =True, p0=parameter_initial)
    stderr = np.sqrt(np.diag(pcov)) #対角行列を取って平方根

    arr_fitted_y = gaussian_func(np.array(arr_x2), popt[0], popt[1], popt[2])
    chisq, p = chisquare(f_exp=arr_y2, f_obs=arr_fitted_y, ddof = 2)
    #print(f"Chi2 {chisq:.6f}")

    mat = np.vstack((popt,stderr)).T
    df = pd.DataFrame(mat,index=("Constant", "Mean", "Sigma"), columns=("Estimate", "Std. error"))
    #print(df)

    if show_plot:
        import matplotlib.pyplot as plt
        plt.errorbar(arr_x,arr_y,linestyle="None",marker="+",yerr=arr_yerror)
        arr_y = gaussian_func(np.array(arr_x),popt[0],popt[1],popt[2])
        plt.plot(arr_x,arr_y)
        plt.show()

    return chisq,popt[0],stderr[0],popt[1],stderr[1],popt[2],stderr[2], len(arr_x) - 3