物理の駅 Physics station by 現役研究者

テクノロジーは共有されてこそ栄える

WindowsでSVG(ベクター画像)ファイルをベクター情報を保持したままEPSファイルに変換する方法

Windows+Officeを使っている筆者は、通常図をOfficeのPowerPointで作成している。某雑誌は提出するファイルにEPS形式を要求しているが、PowerPointから出力できるベクターファイル形式で最も一般的なものはSVGファイルである。

このSVG(ベクター画像)ファイルをベクター情報を保持したままEPSファイルに変換する方法はあるのだろうか?

結論から言うと、条件はあるものの、Windows+Inkscapeで変換が可能である。

inkscape.org

Inkscapeというソフトウェアをインストールしよう。いまは無料のようだ。EXEに署名が入っていないが多分大丈夫。最新版のPythonがバンドルされているが、既にインストールされている場合は必要ない。

次に、Inkscapeの実行ファイルのある場所にPATHを通す。筆者の環境ではC:\Program Files\Inkscape\binだった。SVGをEPSに変換するコマンドは以下の通り。

inkscape -z -o filename.eps filename.svg

比較のためにPDFファイルも作る。筆者の環境では、SVGファイルをGoogle Chromeで開いて、AdobePDFとして印刷した後、Acrobat(有料)でトリミングして生成した。有料なので使えない人は申し訳ない。

図を作る時、PowerPointの図形、文字、ペン、画像を使う。それぞれの組み合わせで図を作った時に、どう変換されるか確認してみた。

まずは、「図形」+「文字」のケース

f:id:onsanai:20210604174040p:plain

PNGはラスター画像でありかつ解像度が悪いのでギザギザが見えるが、EPSとPDFはベクター情報が保持されていてきれいに描画されている。EPSは文字情報を保持しているが、PDFは文字情報は失われているため、検索などでは引っかからない。

次に、「図形」+「文字」+「ペン」のケース

f:id:onsanai:20210604174300p:plain

ペンはラスター画像に変換されることは想定していたが、EPSとPDFの両方で「図形」と「文字」もラスター画像に変換されてしまった。EPSの方を拡大すると、

f:id:onsanai:20210604174414p:plain

となり、確かに縁が滲んでいる。

次に、「図形」+「文字」+「画像」のケース

f:id:onsanai:20210604174443p:plain

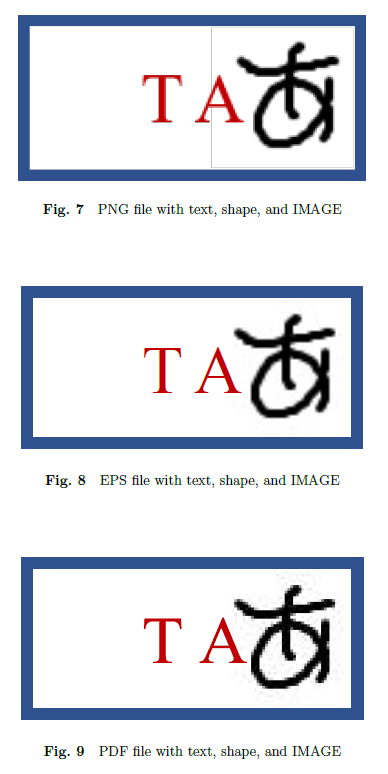
画像はもちろんラスター画像だが、「図形」と「文字」はベクター情報が保持されている。EPSでは文字情報も保持されている。EPSの方を拡大すると、

f:id:onsanai:20210604174534p:plain

問題なさそうだ。

結論

  • PowerPointから出力できるSVGファイルは文字情報を保持したベクター画像である。
  • SVG(ベクタ画像)ファイルはinkscapeを使うと無料でEPSファイルに変換できる。
  • SVGからAcrobatで変換したPDFファイルは文字情報を保持できない。
  • SVGからinkscapeで変換したEPSファイルは文字情報を保持できる。
  • SVGに「ペン」情報がある場合は、EPS、PDFへの変換で「図形」と「文字」のベクター情報が失われる。
  • SVGに「ペン」情報がない場合は、EPS、PDFへの変換で「図形」と「文字」のベクター情報は保持できる。

ということのようだ。

inkscapeコマンドラインのヘルプ

inkscape --help
Usage:
  org.inkscape.Inkscape [OPTION…] file1 [file2 [fileN]]

Process (or open) one or more files.

Help Options:
  -?, --help                                 Show help options
  --help-all                                 Show all help options
  --help-gapplication                        Show GApplication options
  --help-gtk                                 Show GTK+ Options

Application Options:
  -V, --version                              Print Inkscape version
  --debug-info                               Print debugging information
  --system-data-directory                    Print system data directory
  --user-data-directory                      Print user data directory

File import:
  -p, --pipe                                 Read input file from standard input (stdin)
  --pdf-page=PAGE                            PDF page number to import
  --pdf-poppler                              Use poppler when importing via commandline
  --convert-dpi-method=METHOD                Method used to convert pre-0.92 document dpi, if needed: [none|scale-viewbox|scale-document]
  --no-convert-text-baseline-spacing         Do not fix pre-0.92 document's text baseline spacing on opening

File export:
  -o, --export-filename=FILENAME             Output file name (defaults to input filename; file type is guessed from extension if present; use '-' to write to stdout)
  --export-overwrite                         Overwrite input file (otherwise add '_out' suffix if type doesn't change)
  --export-type=TYPE[,TYPE]*                 File type(s) to export: [svg,png,ps,eps,pdf,emf,wmf,xaml]
  --export-extension=EXTENSION-ID            Extension ID to use for exporting
  --
Export geometry:
  -C, --export-area-page                     Area to export is page
  -D, --export-area-drawing                  Area to export is whole drawing (ignoring page size)
  -a, --export-area=x0:y0:x1:y1              Area to export in SVG user units
  --export-area-snap                         Snap the bitmap export area outwards to the nearest integer values
  -d, --export-dpi=DPI                       Resolution for bitmaps and rasterized filters; default is 96
  -w, --export-width=WIDTH                   Bitmap width in pixels (overrides --export-dpi)
  -h, --export-height=HEIGHT                 Bitmap height in pixels (overrides --export-dpi)
  --export-margin=MARGIN                     Margin around export area: units of page size for SVG, mm for PS/PDF

Export options:
  -i, --export-id=OBJECT-ID[;OBJECT-ID]*     ID(s) of object(s) to export
  -j, --export-id-only                       Hide all objects except object with ID selected by export-id
  -l, --export-plain-svg                     Remove Inkscape-specific SVG attributes/properties
  --export-ps-level=LEVEL                    Postscript level (2 or 3); default is 3
  --export-pdf-version=VERSION               PDF version (1.4 or 1.5); default is 1.5
  -T, --export-text-to-path                  Convert text to paths (PS/EPS/PDF/SVG)
  --export-latex                             Export text separately to LaTeX file (PS/EPS/PDF)
  --export-ignore-filters                    Render objects without filters instead of rasterizing (PS/EPS/PDF)
  -t, --export-use-hints                     Use stored filename and DPI hints when exporting object selected by --export-id
  -b, --export-background=COLOR              Background color for exported bitmaps (any SVG color string)
  -y, --export-background-opacity=VALUE      Background opacity for exported bitmaps (0.0 to 1.0, or 1 to 255)
  --export-png-color-mode=COLOR-MODE         Color mode (bit depth and color type) for exported bitmaps (Gray_1/Gray_2/Gray_4/Gray_8/Gray_16/RGB_8/RGB_16/GrayAlpha_8/GrayAlpha_16/RGBA_8/RGBA_16)

Query object/document geometry:
  -I, --query-id=OBJECT-ID[,OBJECT-ID]*      ID(s) of object(s) to be queried
  -S, --query-all                            Print bounding boxes of all objects
  -X, --query-x                              X coordinate of drawing or object (if specified by --query-id)
  -Y, --query-y                              Y coordinate of drawing or object (if specified by --query-id)
  -W, --query-width                          Width of drawing or object (if specified by --query-id)
  -H, --query-height                         Height of drawing or object (if specified by --query-id)

Advanced file processing:
  --vacuum-defs                              Remove unused definitions from the <defs> section(s) of document
  --select=OBJECT-ID[,OBJECT-ID]*            Select objects: comma-separated list of IDs

  --actions=ACTION(:ARG)[;ACTION(:ARG)]*     List of actions (with optional arguments) to execute
  --action-list                              List all available actions

  --verb=VERB[;VERB]*                        List of verbs to execute
  --verb-list                                List all available verbs

Interface:
  -g, --with-gui                             With graphical user interface (required by some actions/verbs)
  --batch-process                            Close GUI after executing all actions/verbs

  --shell                                    Start Inkscape in interactive shell mode


Examples:
  Export input SVG (in.svg) to PDF (out.pdf) format:
        inkscape --export-filename=out.pdf in.svg
  Export input files (in1.svg, in2.svg) to PNG format keeping original name (in1.png, in2.png):
        inkscape --export-type=png in1.svg in2.svg
  See 'man inkscape' and http://wiki.inkscape.org/wiki/index.php/Using_the_Command_Line for more details.

複数のサーバーを、PythonとHTMLで監視する

pingを飛ばすのに pings というパッケージを使った pip install pings でインストール可能。次の例では36台のPCを監視している。

import datetime
import matplotlib.pyplot as plt
import pings

hosts = []
for i in range(1, 37):
    hosts.append("192.168.0.{}".format(i))

p = pings.Ping(timeout=1000)
xs = [0, 1, 1, 0, 0]
ys = [0, 0, 1, 1, 0]
for i, h in enumerate(hosts):
    plt.subplot(6, 6, i+1)
    if i == 0:
        plt.text(0, 1.2, "HTS-1 Alive Monitoring (ping)", size=15)
    if i == len(hosts)-1:
        plt.text(
            0, -0.5, datetime.datetime.now().strftime('%Y/%m/%d\n%H:%M:%S'), size=10)
    plt.text(0, 0, str(i+1), size=20)
    plt.axis("off")
    res = p.ping(h)
    if not res.is_reached():
        plt.fill(xs, ys, color="tab:red")
        plt.axis([0.0, 1.0, 0.0, 1.0])
        print("Not connected", h)
    else:
        plt.fill(xs, ys, color="tab:green")
        plt.axis([0.0, 1.0, 0.0, 1.0])
        print("Connected", h)
plt.savefig("AliveHTS1.png")

生成した画像は、ブラウザ上で見たい。例えば上記のプログラムを1分ごとに自動実行するようにしておけば、それ以上の頻度で画像を読み込めば最新の状況が見れる。

画像の再読み込み(自動リロード)は、一般的な方法である末尾に?と乱数を付けることで実装した。コード例は10秒ごと。実装は下記のURLを参考にした。

<!DOCTYPE HTML PUBLIC "-//W3C//DTD HTML 3.2 Draft//EN">
<html>
<head>
    <title>HTS-1 Alive Monitoring</title>
    <script>
        function reloadimg() {
            AliveHTS1.src = "./AliveHTS1.png?r=" + Math.random();
        }
        function setreload(timer) {
            setTimeout('reloadimg()', timer);
        }
    </script>
</head>
<body>
    <img name="AliveHTS1" src="./AliveHTS1.png" onload="setreload(10000)" />
</body>
</html>

こんな感じで表示される

f:id:onsanai:20210604133925p:plain

参照 iww.hateblo.jp

Pythonで複数のPNG画像をPDFファイルに変換する

画像からPDFにするためのパッケージ img2pdf が必要。

数字を自然順にソートするためのパッケージと関数 natsort natsorted が必要。

PNGファイルに透過チャンネルがある場合、 img2pdf.AlphaChannelError: Refusing to work on images with alpha channel というエラーが出る。アルファチャンネルを削除するための画像処理にOpenCV ライブラリを使った。このまま実行すると画像ファイルは上書きされてしまうので注意。

import img2pdf
import glob
from natsort import natsorted #自然順にするため
import cv2

# 画像一覧を取得
lists = list(glob.glob("*.png"))

# 透過チャンネルがある場合に削除する処理
for filename in lists:
    img = cv2.imread(filename,cv2.IMREAD_UNCHANGED)
    if img.shape[2] == 4:
        img2 = cv2.imread(filename,cv2.IMREAD_COLOR)
        cv2.imwrite(filename, img2)

# PDFファイルを出力
outputpath = "file.pdf"
with open(outputpath,"wb") as f:
    f.write(img2pdf.convert([str(i) for i in natsorted(lists) if ".png" in i]))

pngjpgの両方を取得する場合は "*.[pj][np][gg]"

JPEGファイルにはアルファチャンネルはないので、その部分を削除したコードは以下の通り

import img2pdf
import glob
from natsort import natsorted #自然順にするため
import cv2

# 画像一覧を取得
lists = list(glob.glob("*.jpg"))

# PDFファイルを出力
outputpath = "file.pdf"
with open(outputpath,"wb") as f:
    f.write(img2pdf.convert([str(i) for i in natsorted(lists) if ".jpg" in i]))

Python+matplotlibで長方形 Rectangle を描画する

長方形を描画 matplotlib.patches.Rectangle

サンプルコード

 import matplotlib.pyplot as plt
x,y,width,height = 5,10,20,10
rect = plt.Rectangle((x,y), width, height, edgecolor="black", facecolor="tab:orange")
plt.gca().add_patch(rect)
plt.xlim(0,50)
plt.ylim(0,50)
plt.gca().set_aspect(1)
plt.show()

 0 0 0 -1000.0  6000.0 -1000.0  6000.0     0.0  5000.0     0.0  5000.0 -
 1 1 0  4000.0 11000.0 -1000.0  6000.0  5000.0 10000.0     0.0  5000.0 -
 2 2 0  9000.0 16000.0 -1000.0  6000.0 10000.0 15000.0     0.0  5000.0 -
 3 3 0 14000.0 21000.0 -1000.0  6000.0 15000.0 20001.0     0.0  5000.0 -
 4 0 1 -1000.0  6000.0  4000.0 11000.0     0.0  5000.0  5000.0 10000.0 -
 5 1 1  4000.0 11000.0  4000.0 11000.0  5000.0 10000.0  5000.0 10000.0 -
 6 2 1  9000.0 16000.0  4000.0 11000.0 10000.0 15000.0  5000.0 10000.0 -
 7 3 1 14000.0 21000.0  4000.0 11000.0 15000.0 20001.0  5000.0 10000.0 -
 8 0 2 -1000.0  6000.0  9000.0 16000.0     0.0  5000.0 10000.0 15000.0 -
 9 1 2  4000.0 11000.0  9000.0 16000.0  5000.0 10000.0 10000.0 15000.0 -
10 2 2  9000.0 16000.0  9000.0 16000.0 10000.0 15000.0 10000.0 15000.0 -
11 3 2 14000.0 21000.0  9000.0 16000.0 15000.0 20001.0 10000.0 15000.0 -
12 0 3 -1000.0  6000.0 14000.0 21000.0     0.0  5000.0 15000.0 20001.0 -
13 1 3  4000.0 11000.0 14000.0 21000.0  5000.0 10000.0 15000.0 20001.0 -
14 2 3  9000.0 16000.0 14000.0 21000.0 10000.0 15000.0 15000.0 20001.0 -
15 3 3 14000.0 21000.0 14000.0 21000.0 15000.0 20001.0 15000.0 20001.0 -

というdc2.lstというファイル名のテキストがあったとする。

matplotlibで長方形を描画するためのRectangleを使う。edgecolor or ecfacecolor or fc を使って輪郭と面の色を指定する。

import matplotlib.pyplot as plt
import matplotlib.patches as patches
fig = plt.figure()
ax = fig.add_subplot(111)

xs=[]
ys=[]

for x in range(3):
    for y in range(3):
        xs.append(x*10000)
        ys.append(y*10000)
ax.scatter(xs,ys,marker="x",color="tab:brown")
with open("dc2.lst") as f:
    lines = f.readlines()
    for line in lines:
        strs = line.split()
        x=float(strs[3])
        y=float(strs[5])
        w=float(strs[4])-float(strs[3])
        h=float(strs[6])-float(strs[5])
        rect = plt.Rectangle((x,y),w,h,fc="#0000ff",alpha = 0.1)
        ax.add_patch(rect)
        xi=float(strs[7])
        yi=float(strs[9])
        wi=float(strs[8])-float(strs[7])
        hi=float(strs[10])-float(strs[9])
        rect = plt.Rectangle((xi,yi),wi,hi,ec="#ff0000",alpha = 0.2)
        ax.add_patch(rect)
ax.set_aspect('equal')
plt.show()

TexLive2021のインストールメモ

TexLive 2021がリリースされたため、2020用の tlmgr のコマンドでエラーが吐かれるようになってしまった。

> tlmgr update --list

tlmgr.pl: Local TeX Live (2020) is older than remote repository (2021).
Cross release updates are only supported with
  update-tlmgr-latest(.sh/.exe) --update
See https://tug.org/texlive/upgrade.html for details.

しょうがないので、アップデートする。update-tlmgr-latest(.sh/.exe) --updateしろと書いてるが、Windows版ではメジャーバージョン(例:2020→2021等)のアップデート用exeは提供されていないので、新規インストールする必要がある。念の為、過去のバージョンはバックアップを取っておこう。

ftp.kddilabs.jp

からISO texlive2021-20210325.iso をダウンロードした。md5などでハッシュ値をチェックしておく。マウントして、install-tl-windows.batを起動する。

高度な設定を選ぶ

スキームでfullスキームを選択

VSCodeで編集するので、TexWorksのチェックを外した。ファイルの関連付けもなしに。

PATHを C:\texlive\2020\bin\win32 から C:\texlive\2021\bin\win32 へ変更する。

これだけで、このサンプルはコンパイルできる。

gitlab.com

tlmgr自身のアップデートをするとき (先にやらないと怒られる)

tlmgr update --self

怒られた時のエラー

tlmgr itself needs to be updated.
Please do this via either
  tlmgr update --self

パッケージをアップデートを確認する時

tlmgr update --list

パッケージをアップデートする時。何度もエラーで止まるが、根気強く繰り返す。

tlmgr update --all

これでうまくいくと思いきや、手元のプロジェクトをコンパイルしようとしたら以下のようなエラーが出た

! LaTeX3 Error: Mismatched LaTeX support files detected.
(LaTeX3)        Loading 'expl3.sty' aborted!
(LaTeX3)
(LaTeX3)        The L3 programming layer in the LaTeX format
(LaTeX3)        is dated 2021-02-18, but in your TeX tree the files require
(LaTeX3)        at least 2021-05-07.

expl3.sty:77: LaTeX3 Error: Mismatched LaTeX support files detected. · Issue #811 · latex3/latex3 · GitHub を参考に fmtutil-sys --all というコマンドを叩いて何かを実行すると、コンパイルが通るようになった。このコマンドの完了には10分ほど時間がかかった。

以下、TexLive2020のインストールメモからのコピペ

足りないパッケージを追加する場合は、tlshell を起動

tlmgrのアップデート と出る場合は先にそれをやる。

パッケージリストの状態→すべて にして暫く待つ

検索でパッケージ名を検索→選択→選択項目をインストール

Ubuntu Linux 向け

sudo apt install texlive-lang-japanese texlive-latex-extra 
sudo apt install texlive-publishers
sudo apt install texlive-fonts-extra